Hello world program is a best way to get a first impression about the software.
HawkTracer is a profiling tool, so instead of printing it on a terminal, we'll create measurements labeled with Hello World string!
After this tutorial you'll know how to get time measurements from your own application.
Before you start...
Make sure you already have HawkTracer installed in your system. See Build and Install section to see how to install the project.
Hello World!
Please copy the text below to a file named hawktracer-hello-world.c (you can find this file in the repository as well).
Building and running the example
You can see Integrate HawkTracer to existing project in order to see how to integrate HawkTracer to your project. For the purpose of the example, here are few shortcuts for most popular platforms:
- Linux In the terminal, run the following command: Scroll to Getting the results section to see how to read and analyze profiling results.$ gcc hawktracer-hello-world.c $(pkg-config --cflags --libs hawktracer) -o hawktracer-hello-world # compiling the code$ ./hawktracer-hello-world # running the example
Walkthrough
At the very beginning, we have to initialize the library. The function allocates internal buffers, initializes klass registry etc.
HawkTracer for each measurement generates an Event. Those events are posted to a timeline. In order to process those events, we have to create timeline listeners, which get events from a timeline. It is possible to write your own listener, but the library already provides few of them. One of existing listeners is HT_FileDumpListener which saves events to a file. The listener is created and attached to a timeline by calling ht_file_dump_listener_register() function. It takes the timeline which the listener is attached to, file name, and internal buffer size. Parameter error_code is optional (i.e. can be NULL), and will contain information about failure reason if the listener can't be created.
Code instrumentation
After the initialization, we can instrument the code we want to profile. Pair of functions: ht_feature_callstack_start_string() and ht_feature_callstack_stop() measure the duration of execution of the code between those functions, and label the measurement with the string specified as a second argument. It's also possible to make nested calls of this functions, as we can see in the example below:
C++/GNU C instrumentation improvements
For C++ and GNU C compilers HawkTracer offers macros HT_G_TRACE_FUNCTION() and HT_G_TRACE_OPT_STATIC() which measure the scope of the macro call, e.g. if you put HT_G_TRACE_FUNCTION() at the beginning of your function, it will automatically measure the scope of the entire function. Moreover, macros above generate less data as they use cache feature. (TODO: provide a reference for this feature)
The instrumented code above can be replaced with the following:
A full C++/GNU C example can be found in the repository.
Cleanup
As mentioned in previous sections, HawkTracer takes care of destroying the listener object, so even though we allocated it, we don't have to manage it - the ownership has been transfered to the timeline. The only operation we have to do, is to deinitialize the library:
Getting the results
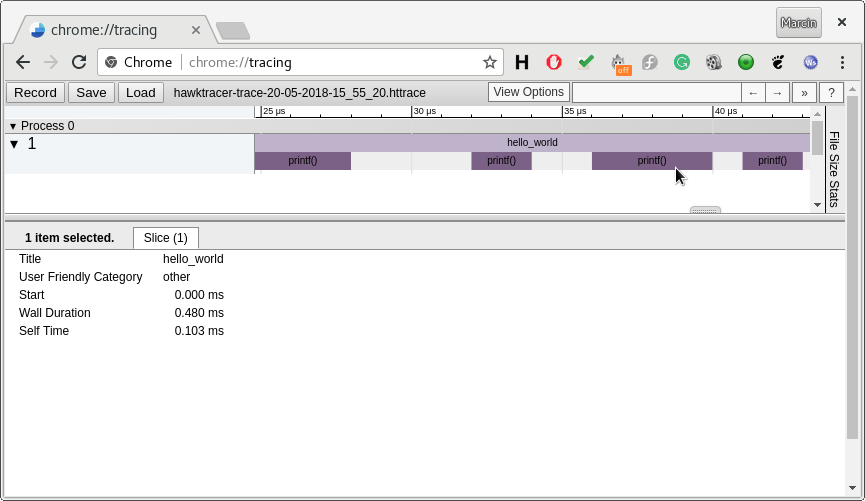
After compiling and running the code, you should see hello-world-out.htdump file. This file contains binary data, and can't be directly used for performance analysis. HawkTracer doesn't provide it's own viewer yet, but it provide converters to formats supported existing and well-known viewer tools. For example, in order to convert file to json format (which can be opened by Catapult Trace Viewer, run the following command:
Catapult Trace Viewer is provided with Google Chrome and Chromium browsers, so we recommend to install one of them. Open Google Chrome or Chromium browser, and go to chrome://tracing URL. In the top left corner you should see Load button, which allow you to specify a path to the json file (in our case, it's hello-world-out.json). After this, you should see a callstack view of your the program.